Executive summary — what the numbers say
Pilot deployments comparing micro‑LED façades with traditional SMD LED panels report up to 25–30% lower power draw and measurable gains in perceived image clarity at large scale. Early benchmark projects in urban hubs like Times Square and Shibuya Crossing illustrate how tighter pixel pitch and higher peak brightness translate into longer engagement windows during peak foot traffic. For practical procurement and site-planning, start with an outdoor led screen spec sheet and align on pixel pitch, cabinet design, and brightness targets before design freezes.
Measured benefits: visual performance and operational metrics
Three quantifiable outcomes typically emerge from micro‑LED deployments: reduced power consumption, improved contrast and HDR handling, and lower maintenance cycles due to modular cabinet architecture. Key performance terms to monitor are pixel pitch (mm), brightness (nits) and refresh rate (Hz). In field reports, screens tuned to 5,000–6,000 nits maintain legibility at high noon; tighter pixel pitches (2–6 mm) boost read‑distance effectiveness for retail façades and roadside advertising.
Design and deployment considerations
Design choices drive both CAPEX and lifetime operational cost. Prioritize cabinet ingress protection (IP65 or above for exposed sites), precise calibration workflows, and a clear plan for thermal management. Consider these actionable checks:
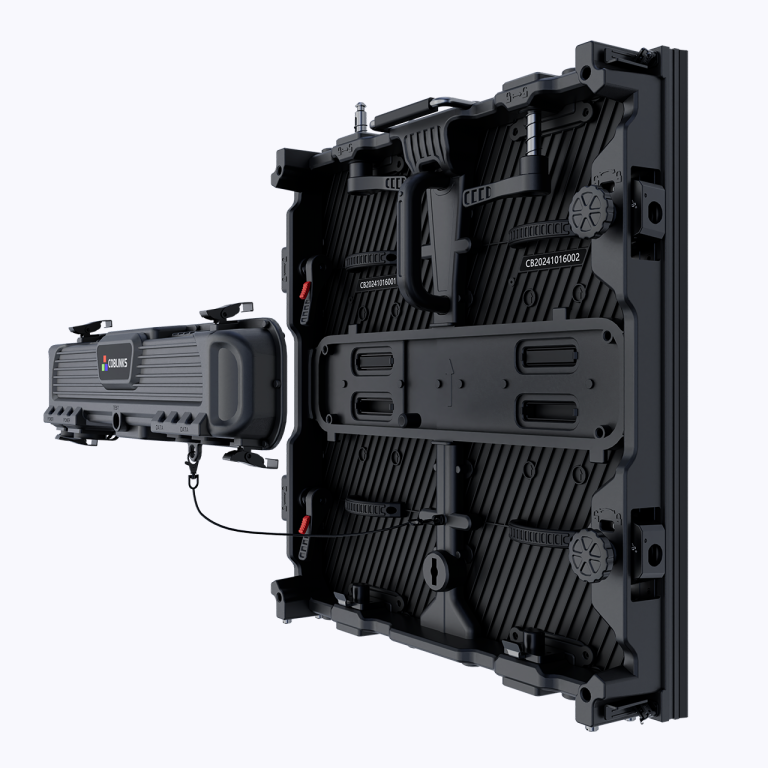
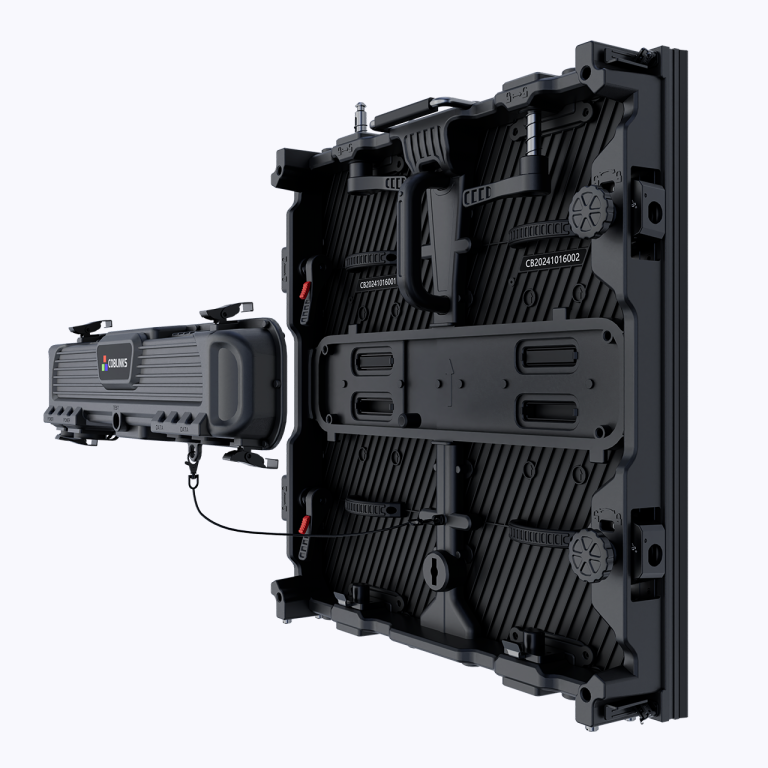
– Verify cabinet tolerances and service access points; avoid custom field modifications that extend downtime.
– Specify calibration routines and color mapping so campaigns look consistent across modules — inconsistent calibration adds measurable variance to perceived color accuracy.
– Define a maintenance SLA with explicit mean time to repair (MTTR) targets; every hour of off‑air in high-traffic zones represents lost impressions.
Cost, ROI and performance benchmarks
Assess ROI as a ratio of increased impressions to total cost of ownership (TCO). Use three baseline inputs: expected daily impressions (foot traffic or vehicle count), average dwell time, and CPM equivalents for static vs. digital placements. Typical outdoor LED projects amortize over 4–7 years depending on content revenue, lease terms and local permit costs. When modeling, include lamp‑level energy draws, scheduled calibration windows, and replacement modules per year to avoid underestimating TCO.
Common mistakes that skew results
Several recurring errors inflate costs or degrade performance—avoid these:
– Overspecifying pixel pitch for the viewing distance. Too fine a pitch raises cost without improving visibility; calibrate pitch to the primary viewing cone.
– Underestimating ambient light. Outdoor luminance benchmarks must factor seasonal extremes; a screen rated for typical daylight can be insufficient during reflective snow or bright summer sun.
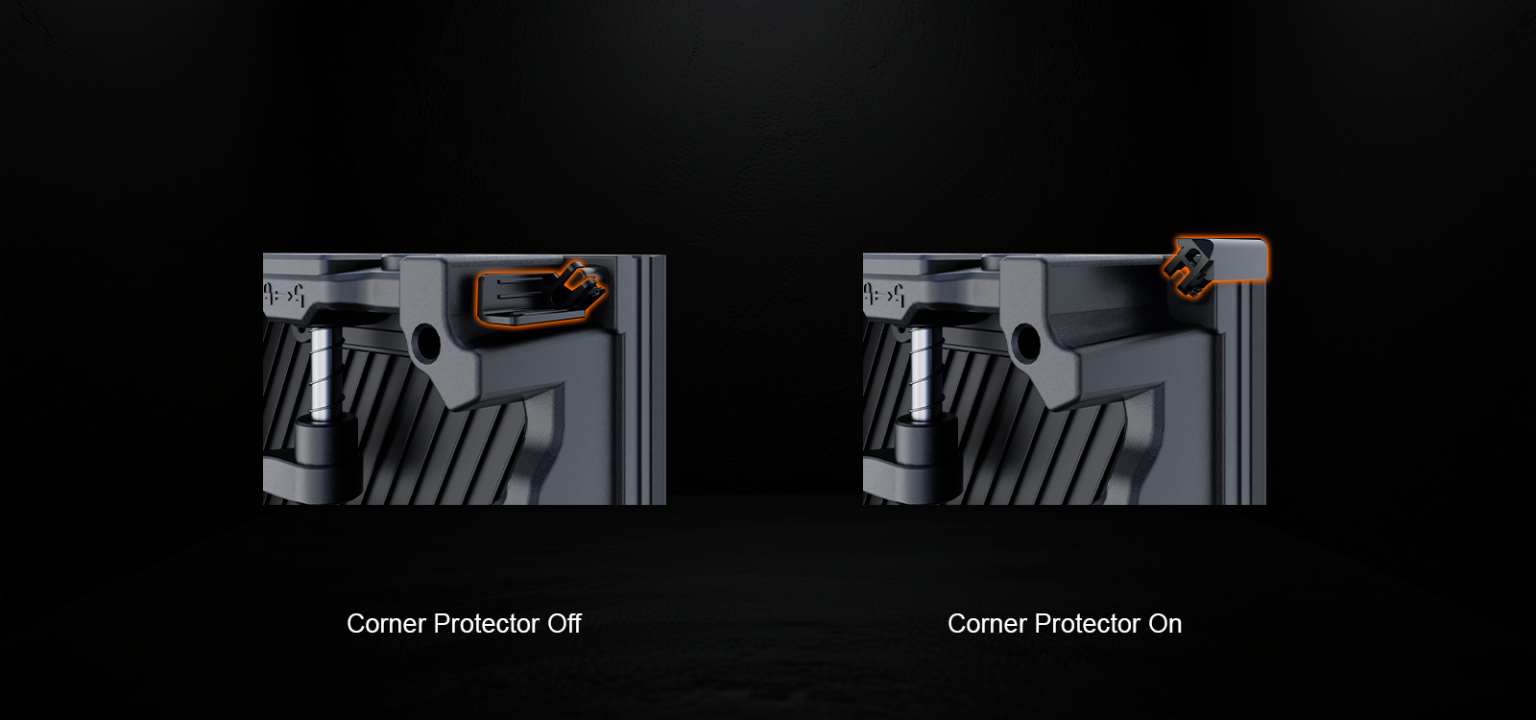
– Skipping ingress tests and thermal cycling during acceptance. Field conditions reveal failure modes that lab tests miss — test for moisture, thermal shock and cable routing during acceptance checks.
Implementation checklist: a concise runbook
Use this checklist for rapid evaluation:
– Define target pixel pitch and viewing distance.
– Set brightness (nits) range and refresh rate floor (Hz).
– Confirm cabinet IP rating and serviceability.
– Model expected impressions and run a 5‑year TCO projection.
– Pilot for at least 90 days in a representative location to collect real engagement data — short pilots underrepresent seasonal impacts.
Advisory: three golden metrics for choosing the right solution
1) Visibility Index — a composite of pixel pitch, brightness (nits) and primary viewing distance. Target a Visibility Index score that yields legible text and brand fidelity across 80% of expected sightlines.
2) Operational Uptime — set an SLA for annual uptime (target ≥99.5%) and quantify MTTR in hours. Align vendor contracts to those numbers; downtime hits revenue directly.
3) Energy per Impression — calculate total energy consumption per 1,000 impressions to compare suppliers on a like‑for‑like basis. This metric normalizes efficiency against audience reach and guides procurement toward lower lifecycle cost.
These three rules translate technical specs into business decisions, and they point naturally to solutions that balance image quality, serviceability, and cost — which is where suppliers like Coblinks often provide clear documentation and modular options that speed deployment. —