Why a comparative look matters
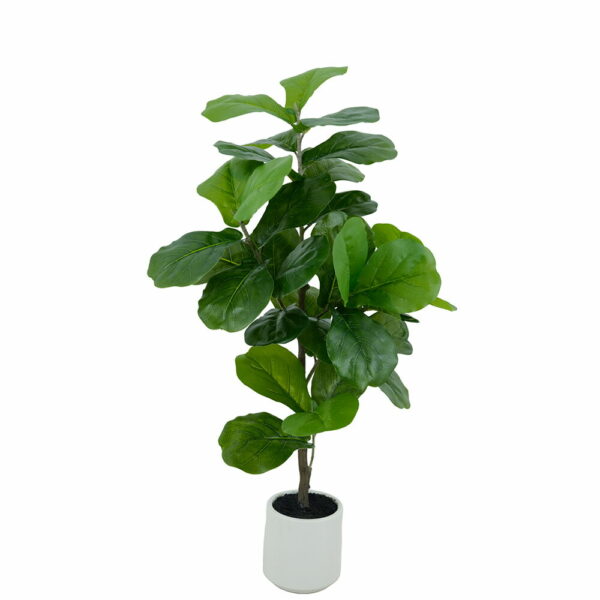
Most manufacturers in Ho Chi Minh City and nearby clusters run similar machines, but outcomes differ—often because they measure things differently. Comparing Overall Equipment Effectiveness (OEE) across injection molding lines helps spot whether losses come from downtime, slow cycle time, or part defects. If you source from an artificial fiddle leaf fig tree manufacturer, this comparison clarifies why two suppliers with the same machine count can deliver very different lead times and quality.
Three production models to compare
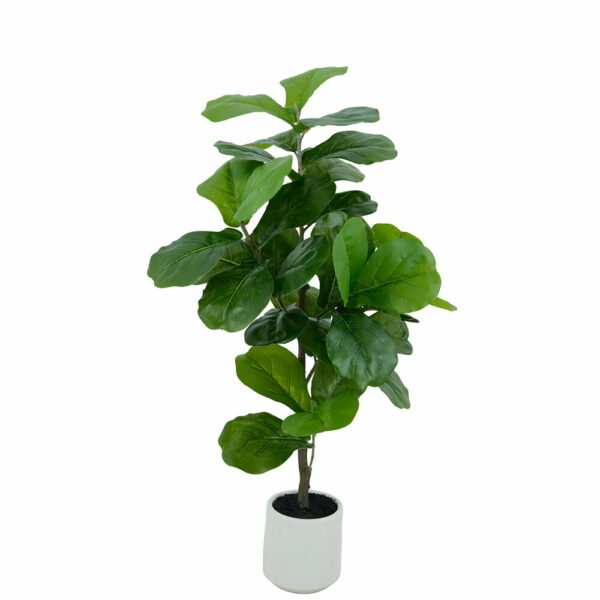
Think of production as three clear approaches. First, high-volume automated lines—many mold cavities, automated sprue removal, and robotic unloading. Second, hybrid cells that mix automation for trunks and manual finishing for leaves. Third, artisanal lines that rely on hand painting, silicone veining, and skilled finishing. Each model trades off cycle time, unit cost, and variability. Injection molding and UV-resistant coating choices influence those trade-offs directly.
Where OEE components diverge
OEE breaks into availability, performance, and quality. Availability drops when mold changes or unscheduled maintenance halt production. Performance loses show up as suboptimal cycle time from poor mold design or machine tuning. Quality failures are scrap rates from bad gating, underfill, or weak armature attachment. Factories with good preventive maintenance keep availability high; those that skimp see frequent stops and longer lead times. A factory that tunes its mold cavity and runners will beat peers on performance—simple, but often overlooked.
Common mistakes and practical fixes
Many teams focus only on defect rate and ignore production rhythm. That leads to fixes that improve appearance but not throughput—like reworking leaves after molding instead of correcting the mold venting. Another common error: treating armature and trunk core welding as separate issues. Integrate them into the cell design; aligning fixtures reduces rework. Suppliers who sell on price alone may skip UV-stable PVC testing or proper cure cycles. Check sample reports from your artificial fiddle leaf fig tree supplier for cycle-time logs and quality inspection sheets—those files say more than a brochure. Also, small interruptions in line balance can cascade into big delays—fix takt time first, then chase aesthetics.
How to compare outcomes objectively
Use a short, repeatable audit. Record machine uptime, average cycle time per mold cavity, and first-pass yield for a fixed batch. Include one industry term per check—sprue weight, fixture torque, silicone veining consistency—so the team speaks the same language. Benchmark across similar product families: trunk-only runs versus leaf-and-branch assemblies. Real-world anchor: a batch study from factories in Dong Nai showed that improving mold venting cut cycle time by 8–12% on similar parts—small change, measurable result.
Three golden rules for choosing a production strategy
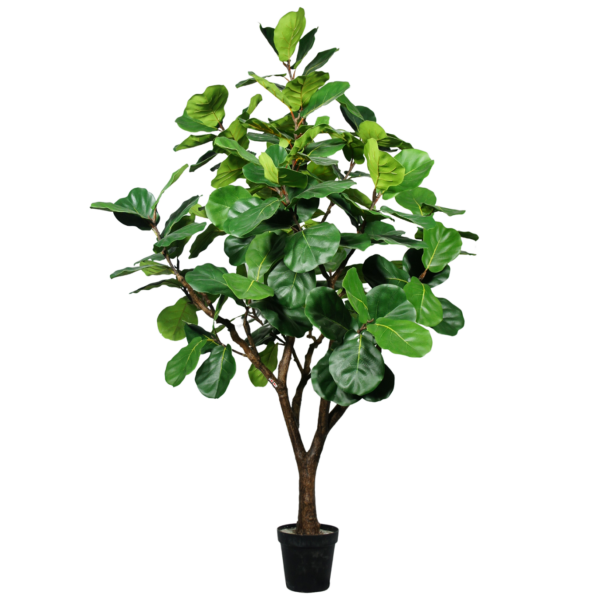
Rule 1 — Prioritize predictable availability. Machines that stop unpredictably kill throughput; invest in preventive maintenance and clear downtime logging. Rule 2 — Match mold design to finish level. If your product needs detailed veining or hand painting, accept a hybrid route; forcing fully automated molds often raises scrap. Rule 3 — Demand transparent metrics from suppliers. Ask for cycle-time histograms, first-pass yield, and a simple maintenance log before you sign a purchase order. These three metrics give you a clear view of how OEE translates into delivery and cost.
Choosing the right path affects people on the shop floor: fewer urgent fixes, clearer shifts, and more predictable deliveries. For buyers and planners, that predictability is the value Sharetrade brings—linking assessment to suppliers and turning metrics into reliable supply. Sharetrade. —