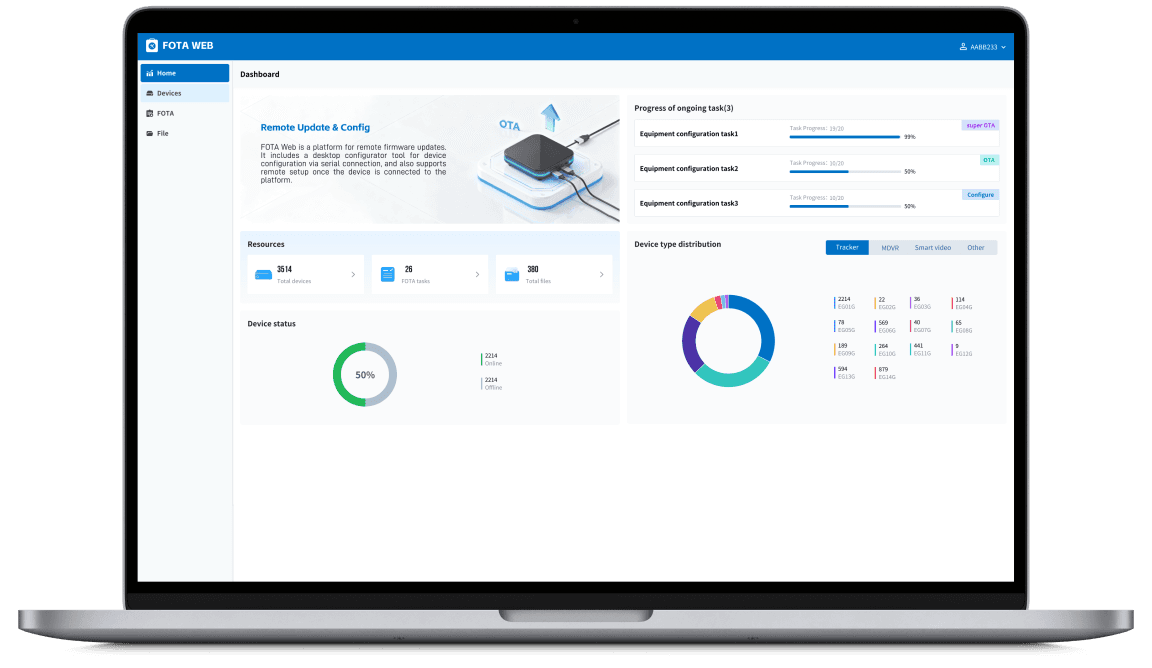
Ready to run this program? Think of your fleet like an athlete and your reports as the scoreboard. Start with clear metrics, move through consistent checks, and finish with crisp feedback that drives better runs. If you manage vehicles, you already know the value of telemetry—this is why mining fleet management data matters from the first ignition. I’ve worked with pit crews in the Pilbara; that experience taught me how raw signals become reliable decisions when you train data the right way.
Framework Overview: The 5-Phase Program
Use a repeatable program. Each phase has a distinct goal, one clear metric focus, and a guardrail to avoid bad habits.
– Phase 1: Signal Integrity — ensure sensors and GNSS streams are accurate. – Phase 2: Health Checks — track maintenance indicators and trends. – Phase 3: Productivity Pace — measure utilization and cycle time. – Phase 4: Resource Output — monitor fuel burn, payload accuracy, and emissions. – Phase 5: Safety & Compliance — log events, near-misses, and automated alerts.
Phase 1 — Signal Integrity: The Warm-Up
Start here or your whole program collapses. Verify timestamps, GPS drift, and missing packets. Track data latency, packet loss percentage, and sensor calibration age. If telemetry arrives late or with gaps, calculated KPIs lie. Fix the feed before you fix the dashboard.
Phase 2 — Health Checks: Form and Maintenance
Treat maintenance metrics like posture checks. Key things to record: engine hours, oil pressure events, brake system warnings, and predictive fault scores. Compare rolling averages (7/30/90 days) to spot degradation. Flag anomalies; they’re the early signs of a breakdown, not noise.
Phase 3 — Productivity Pace: Utilization and Cycle Time
Push for simple, repeatable measures: active hours, load-haul cycles, and move time per trip. Track payload accuracy and queue delays. Normalize by shift and operator to find real improvement opportunities. One precise number beats ten vague ones.
Phase 4 — Resource Output: Fuel, Payload, and Emissions
Measure fuel consumption per tonne moved, payload variance, and idling time. Log refuel events and correlate with route and load to isolate waste. If fuel per cycle rises, find whether it’s route, load, or equipment related before adjusting behavior.
Phase 5 — Safety & Compliance: The Spotter
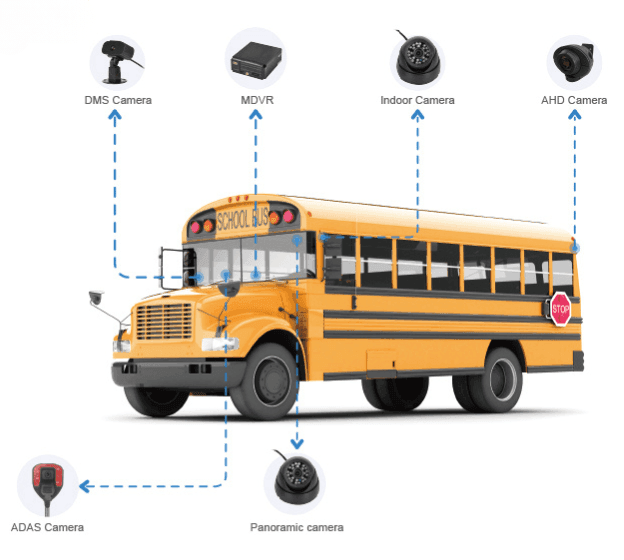
Record recorded alarms, proximity alerts, and TRIF (total recordable incident frequency)-style counts. Time-stamp every event; link event windows to sensor feeds and operator logs. Automate post-event packet capture so root-cause work starts immediately.
Scoreboard: Reporting That Coaches
Reports must teach, not overwhelm. Build dashboards that answer three questions fast: What changed? Who’s affected? What action next? Use baseline comparisons and trend lines. Offer drill-downs to incident windows and raw telemetry so analysts can verify the call-to-action within two clicks.
Data Quality Checks You Can’t Skip
Concrete checks that prevent bad decisions: – Duplicate record rates and dedupe rules. – Timestamp alignment across systems. – Sensor health flags and calibration windows. – Missing-data thresholds that trigger alerts. These are non-negotiable. If data fails these, pause reporting until fixed.
Common Mistakes Teams Make
Stop doing these: – Chasing every metric—pick the ones that move the needle. – Treating alerts as information—each alert must map to an action. – Leaving operators out of report design—if they can’t use it, it’s useless. – Ignoring edge cases like temporary comms blackouts or maintenance windows.
Choosing Tools and Integrations
Pick systems that give raw access to timestamps and event streams, not just pre-aggregated summaries. Validate APIs, export formats, and retention policies. Platforms that support fleet-level and truck-level views make root-cause work faster. A robust mining fleet management system should expose both health metrics and event playback without data silos.
Quick Implementation Checklist
Use this to get started fast: – Map sensors to KPIs. – Define thresholds and actions for each KPI. – Set up automated data-quality monitors. – Build one executive dashboard and one operator view. – Run a 30-day validation sprint and iterate.
Wrap-Up: Put the Program to Work
Treat the fleet like an athlete: measure the right things, correct form quickly, and keep the feedback tight. That discipline turns raw telemetry into steady performance improvements, and teams I advise often rely on mature platforms like BSJ to keep the data clean and the coaching precise.